Evolving Main Screen TV Viewing - August 2020 Update
SPORTS ARE BACK, BUT CABLE AND SATELLITE MAIN SCREEN VIEWING IS NOT
USIM has analyzed seven months of Inscape Automated Content Recognition (ACR) main screen TV viewing data. As more devices, apps, and connections are made to the main screen TV, we have found ACR data to be an ideal way to measure consumer’s changing viewing habits. Additionally, we can glean enough specific information to deep dive at the hyperlocal level.
We have looked at the data of total viewing minutes on an average day from the main screen. This allows us to compare the viewing differences in days per month.
In our August 2020 study update, we addressed the following questions:
- Did the changes to main screen TV viewing hold up as the initial COVID-19 wave receded in August?
- Are the changes we see to main screen viewing patterns uniform across the top 10 US cities?
Did the changes to main screen TV viewing hold up as the initial COVID-19 wave receded?
We looked at the average daily total viewing minutes for four major device categories measured by the ACR data:
- Cable & Satellite Box viewing
- OTT viewing via a streaming device such as Roku, Amazon Fire, Apple TV, Chromecast
- App services viewing of a Smart TV or device app such as Youtube & Youtube TV, Tubi, Pluto TV, WatchFree (Vizio channel), etc.
- Other (primarily Gaming Consoles) viewing of gaming devices plus devices that use the TV as a monitor
Note: Inscape ACR data does not report any viewing to Netflix, Amazon Prime Video, or HULU.
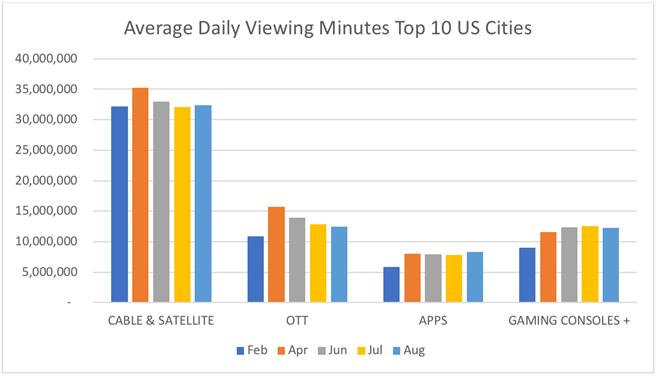
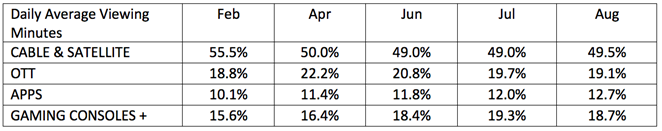
Viewing minutes of broadcast and cable channels via cable and satellite boxes in August have edged above pre-COVID-19 February levels. But the dramatic loss of share of total viewing minutes has not returned and remains at the 49% level – an 11% loss of viewing share to streaming that, on current evidence, appears permanent.
With the return of sports to TV in August, we compared the top 20 shows viewed across the top 10 cities in pre-COVID-19 times (February), during COVID-19 (April), and currently in August. Sports shows have immediately regained their place at the top of the rankings, but have not recovered to the level of viewing that was expected. It will be interesting and critical for the broadcast networks to see the impact that the return of the NFL in September will have on viewing levels.
We were also surprised to see how the measured OTT of Amazon Firestick, Roku, etc., (Netflix, Amazon Prime & HULU are excluded), have fallen back to the pre-COVID-19 viewing levels. OTT had the most dramatic gains during this period but has not held onto the share of viewing on main screen TV. However, it still has a higher total viewing share than pre-COVID-19.
Gaming Consoles, while slightly declining in volume and share of viewing from its COVID-19 peak, are still dramatically above pre-COVID-19 levels and, for the moment, seem likely to maintain a higher share.
Viewing to APPs (e.g., YouTube, Tubi, Pluto, etc.) continues to grow in total minutes viewed and in capturing a share of main screen viewing. APPs share of total main screen viewing has grown 25% since February, and there is no evidence that growth is slowing.
Are the changes we see to main screen viewing patterns uniform across the top 10 US cities?
The patterns we have seen in the national summary are generally the same in the top 10 cities we examined, but the total viewing minute levels vary significantly and warrant careful analysis at the hyperlocal level.
The growth in OTT and APP viewing is not consistent across the top 10 cities in the US and we see some significant differences between cities. What seems to hold true is that APPs viewing is consistently growing at a higher rate than OTT. Digging deeper, we can see that the advertising-supported APPs have quite different viewing levels in different markets, although YouTube is consistently the dominating market leader.
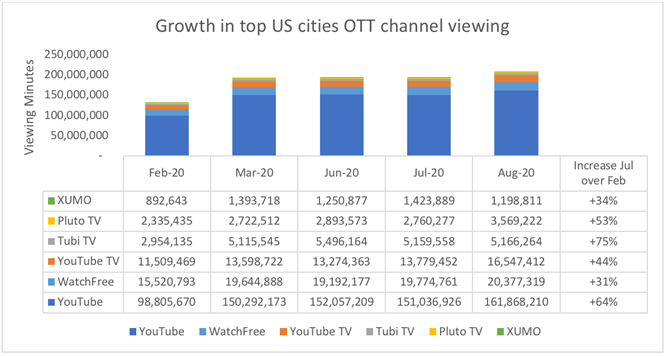
Viewers are continuing to seek out free streaming ad-supported content from APPs on their TVs such as YouTube, Tubi, and Pluto TV.
Conclusion:
Even with the return of Sports to TV in August, viewing via traditional Cable Box and Satellite has yet to return to pre-COVID-19 levels. Viewers have discovered that quality content is available to them on-demand via ad-supported APPs and are continuing to view them. Additionally, the increased viewing on Amazon Firesticks and Roku devices has fallen back towards pre-COVID-19 share of main screen viewing.
The city-by-city variation we see in viewing to different APPs and OTT devices merits very careful examination to deliver the ideal reach to hard-to-find customer segments.