
Evolving Main Screen TV Viewing - July 2020 Update
USIM has analyzed seven months of Inscape Automated Content Recognition (ACR) main screen TV viewing data. As more devices, apps, and connections are made to the main screen TV, we have found ACR data to be an ideal way to measure consumer’s changing viewing habits. Additionally, we can glean enough specific information to deep dive at the hyperlocal level.
We have looked at the data of total viewing minutes on an average day from the main screen, allowing us to compare the viewing differences in days per month.
In our July 2020 study update, we addressed the following questions:
- Did the changes to main screen TV viewing hold up as the initial COVID-19 wave receded in July?
- Are the changes we see to main screen viewing patterns uniform across the top 10 US cities?
- Which services and content that gained significantly in the immediate COVID-19 period, are subsequently losing viewing?
- What services and content retained high viewing levels?
Did the changes to main screen TV viewing hold up as the initial COVID-19 wave receded in July?
Looking at average day total viewing minutes for four major device categories measured by the ACR data:
- Cable & Satellite Box viewing
- OTT viewing via a streaming device such as Roku, Amazon Fire, Apple TV, Chromecast
- App services viewing of a Smart TV or device app such as Youtube & Youtube TV, Tubi, Pluto TV, WatchFree (Vizio channel), etc.
- Other (primarily Gaming Consoles) viewing of gaming devices plus devices that use the TV as a monitor
Note: Inscape ACR data does not report any viewing to Netflix, Amazon Prime Video, or HULU.
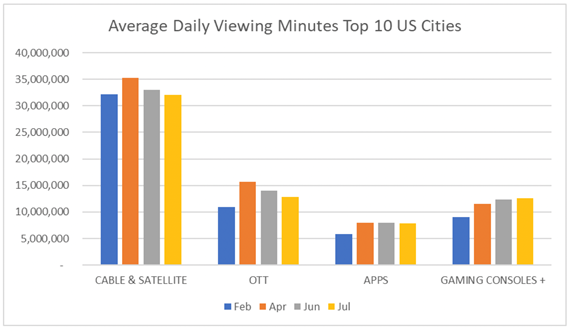
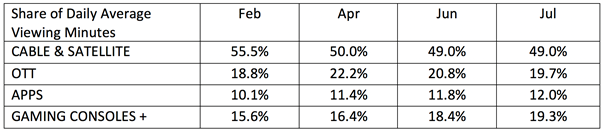
Viewing minutes of broadcast and cable channels via cable and satellite boxes in July have returned to pre-COVID-19 February levels. The dramatic loss of share of total viewing minutes has not returned and has stabilized at the 49% level – a 12% loss of viewing share to streaming that, on current evidence, appears permanent. Based on what we can measure, less than half the viewing usage of the TV main screen is now through a cable or satellite box.
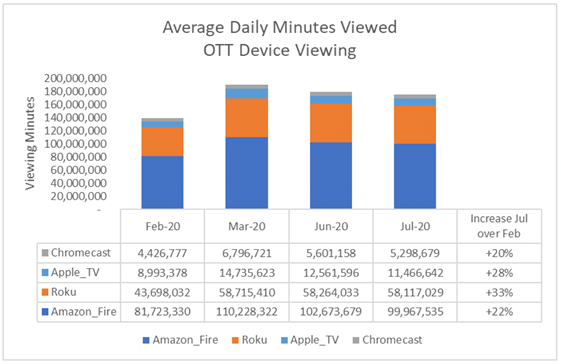
OTT viewing that is measured (Netflix, Amazon Prime & HULU is excluded) gained the greatest total viewing minutes and share during the peak of the COVID-19 crisis in April, but both the total viewing minutes and OTT’s share of viewing minutes have somewhat eroded since that high point. Both numbers are still well above their February pre-COVID-19 point however, we would expect to see the current levels remain consistent for the near future.
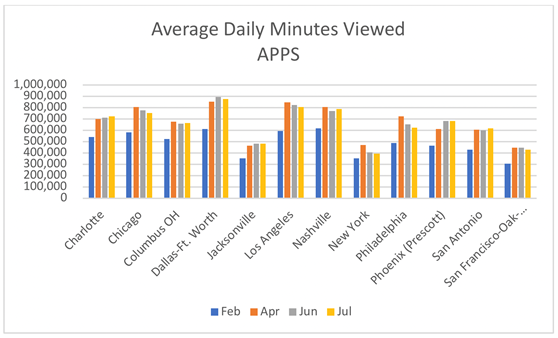
On the other hand, APP viewing has retained the gains and the share in total viewing minutes. As Smart TV app stores continue to grow and expand the choices available to viewers, particularly the free ad-supported content apps, we expect to see the continued slow rise in minutes and share of viewing to APPs.
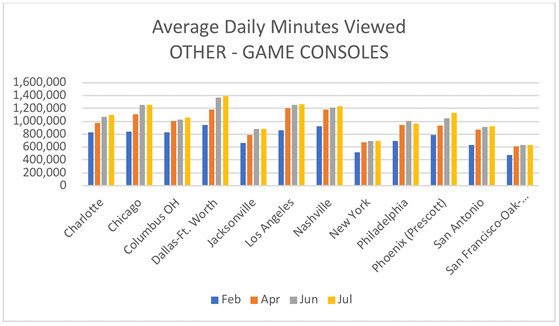
Clearly, gaming consoles have continued to play an increasingly important part in main screen TV usage over the past lockdown period. Even without the launch of any new generation of consoles, gains in total minutes and share of viewing minutes have continued at pace.
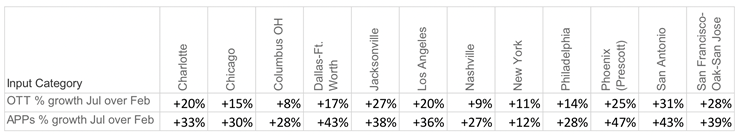
Are the changes we see to main screen viewing patterns uniform across the top 10 US cities?
The patterns we have seen in the national summary are generally the same in the top 10 cities we examined, but the total viewing minute levels vary significantly and warrant careful analysis at the hyperlocal level.
What services and content that gained significantly in the immediate COVID-19 period, are subsequently losing viewing?
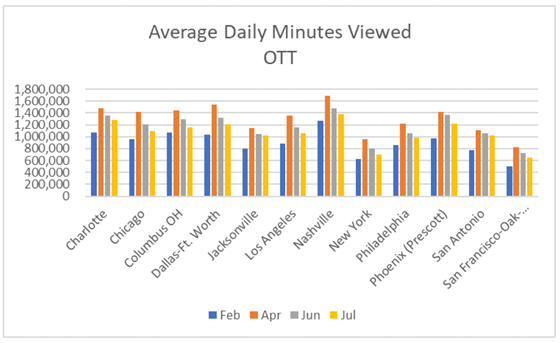
OTT Devices
In the peak COVID-19 period, Roku is the only one of the major streaming devices to has held on to their gains in viewing minutes. Amazon Firestick, while far and away the leader in total minutes viewed, has seen approximately 50% of its gains from April erode.
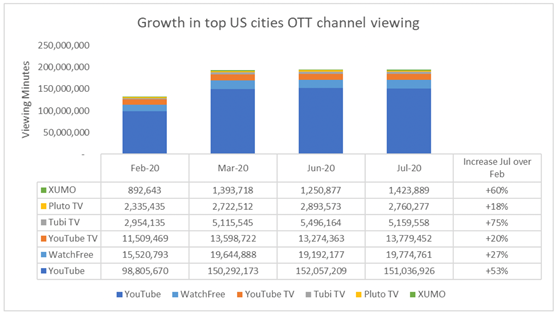
Stream APP services
All the major streaming apps retained the viewing levels they gained during the COVID-19 lockdown period. YouTube maintains its dominant position in main screen viewing minutes. WatchFree, the free offering from Vizio, came in second since Inscape data only measures Vizio smart TV viewing. We can expect similar performance from the other smart TV manufacturer channels (e.g., LG’s LG Channels).
This July report supports our view that consumers are increasingly looking for free ad-supported content to supplement the paid subscription services they already have (Netflix, HULU, etc.).
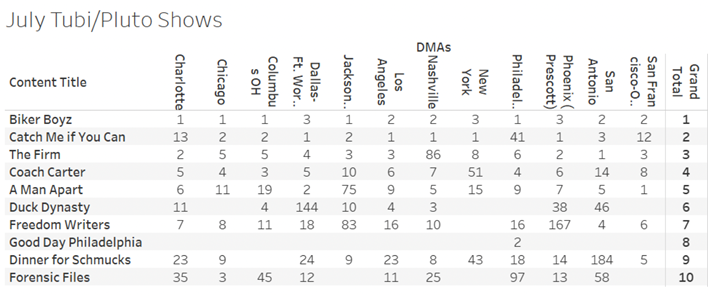
If we look at the content ranked by city for Tubi and Pluto (similar free ad-supported streaming apps), we see that ‘evergreen’ movies are by far the most popular choice.
Conclusion:
Viewing patterns are stabilizing for the moment with this ‘new normal' of reduced broadcast and cable share of main screen TV viewing. However, free ad-supported app viewing is still growing and streaming devices are maintaining their gains.
Gaming console usage has benefited immensely due to the increased time at home and, as new console generations roll out during the holidays (e.g., Playstation 5/Xbox Series), we might expect to see that growth continue.