
How Main Screen, Ad-Supported TV Viewing has Evolved After One Year of COVID-19
Summary: What you need to know
In the last 12 months (Feb. 2020 to Feb. 2021), we have seen ad-supported, main-screen TV viewing (excluding Netflix, etc.) rise steeply during lockdown then fall back somewhat. February 2021 saw daily average ad-supported viewing up 16% in the top 10 US DMAs over last year, but the gain is nearly all accounted for by addressable and connected formats. Plug-in device (such as Amazon Fire TV Sticks and Roku sticks) viewing is up 28% and Smart TV app viewing is up 54%. This has significantly increased the opportunities to effectively reach customized audience segments across the US. Content viewing has not changed significantly as yet with sports still dominant, but we are beginning to see increased viewing of the most popular content (like “Friends”) provided on demand by ad-supported free streaming services.
Detailed Study
USIM has been monitoring the changes in ad-supported, main-screen TV using Vizio’s ACR panel data to dig deeper into viewing. ACR data reveal what actually shows up on the TV screen and (importantly) how it gets there – whether through traditional cable/satellite boxes, devices like Amazon Fire TV Sticks or Roku devices or via apps installed on Smart TVs such as YouTube, Tubi and Pluto.
We focused on viewing in the top 10 DMAs in the US. The Vizio panel, while not fully balanced for the total population, is easily big enough to offer some great insights about how main-screen TV viewing has evolved over the last 12 months. We have focused on ad-supported TV viewing, excluding all Netflix, Amazon Prime and Hulu viewing minutes.
Overall main-screen, ad-supported viewing:
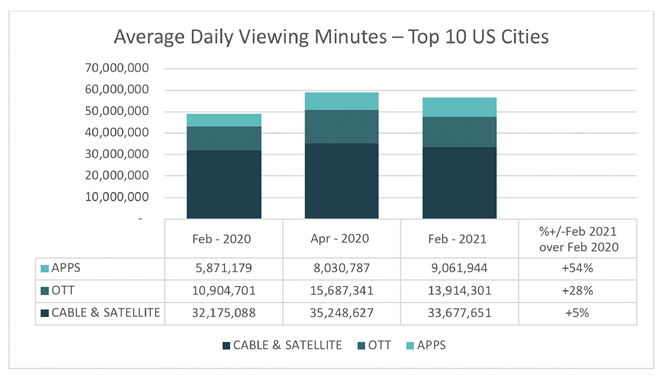
Total ad-supported minutes viewed for Feb. 2021 were 16% up over February 2020, but it wasn’t an even distribution. The biggest gains in ad-supported viewing were via main-screen viewing apps, which increased 54% in the year of COVID-19. Viewing via OTT devices like Amazon Fire TV Sticks and Roku sticks increased 28% in 12 months. Viewing via traditional cable and satellite boxes still make up the majority of ad-supported viewing and did still increase, but only by 5% – significantly less than the overall viewing increase.
Compared to the height of the lockdown period when we saw main screen, ad-supported TV viewing peak, we see that traditional cable, satellite and OTT device viewing has fallen back marginally but that viewing of ad-supported, main-screen TV apps has continued to grow.
Looking at the OTT devices, we can see that the most growth has come from Apple TV and Roku devices, but the Amazon Fire TV Stick has preserved its dominant lead as the most-viewed OTT device for ad-supported, main-screen TV viewing.

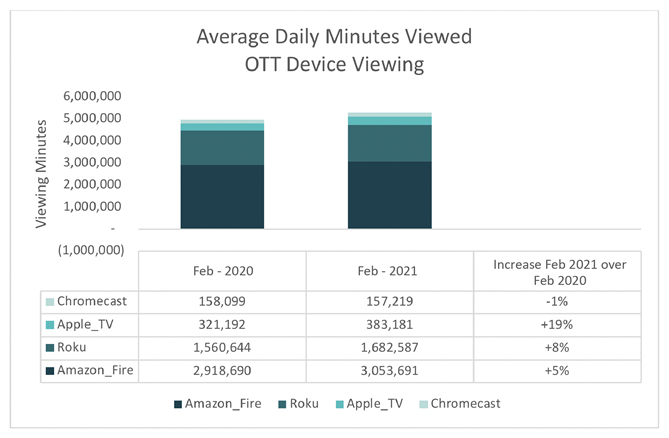
It’s important to note, though, that this data is specifically for OTT devices like sticks or boxes that plug directly into an HDMI port of the Vizio Smart TV panel. Roku has a Smart TV app and is also the operating system for many of the increasingly popular TCL TVs, which would significantly increase Roku’s total share of ad-supported, main-screen viewing beyond what we can see from the Vizio panel.
It is viewing of Smart TV apps where we have seen the most explosive growth over the COVID-19 period with an overall 50%-plus increase in ad-supported, main-screen TV viewing. Here we have looked at just the top ad-supported apps (again, Netflix, Amazon Prime Video and Hulu are excluded).
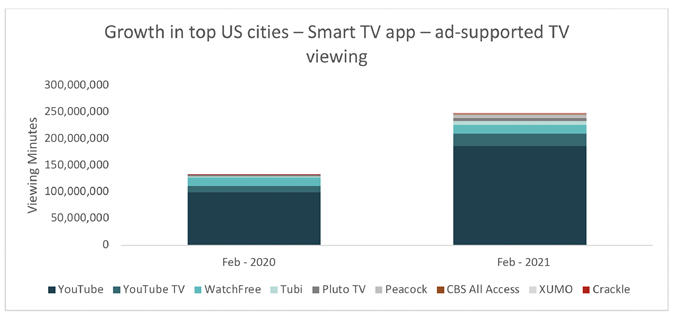
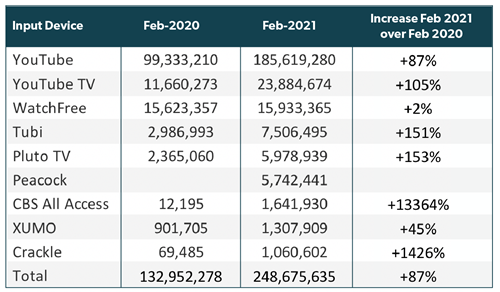
The YouTube app on Smart TVs has almost doubled its viewing minutes over 12 months to become an important reach in delivering channel to main-screen TVs. YouTube TV – the subscription service for pay TV – has also grown significantly but from a much smaller base. Interestingly, the free Vizio ad-supported channel on Vizio TVs – WatchFree – has shown no growth over the period compared to other ad-supported app platforms like Tubi and Pluto, which had 150% growth. From this data, we can see just how quickly Peacock has grown as an app service that did not exist in February 2020.
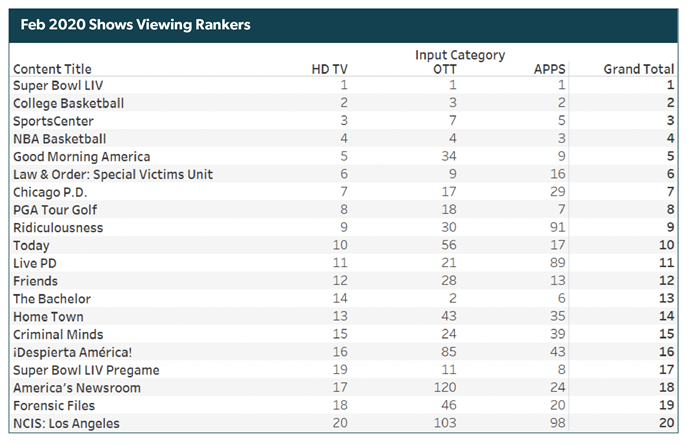
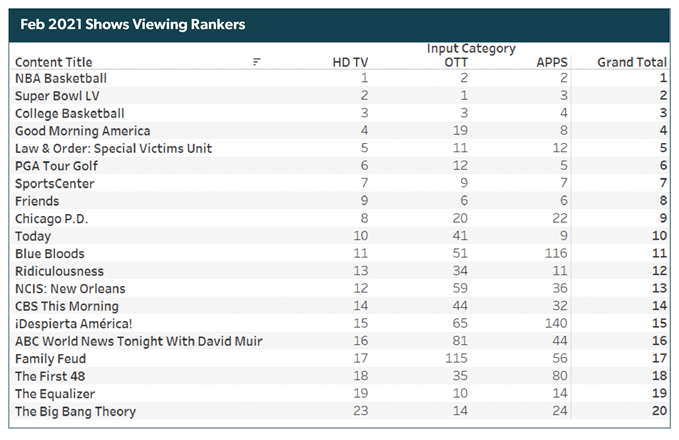
Finally, we looked at the shows people have been watching on ad-supported, main-screen TVs. Things haven’t really changed that much – sports still dominate the viewing rankers – but we can see some shows provided by Smart TV apps inspire repeat viewing (“Friends”, “Big Bang Theory”), which are beginning to rise through the rankings.
Here are the top 20 shows from February 2020:
And here are the same rankers for February 2021:
Insights and action points
The big increases in ad-supported viewing to traditional cable and satellite distributors we saw during the height of the COVID-19 lockdown have pretty much dissipated, and viewing from Feb. 2020 to Feb. 2021 has remained stable on those platforms. There has been far more growth in device and app viewing in the last 12 months, increasing the ability for advertisers to reach a much greater percentage of the viewing population via addressable and programmatic TV routes. What people are watching hasn’t really changed very much in a year, but how they are watching it continues to evolve as they embrace new ad-supported platforms and devices.