
How Main Screen TV Viewing Has Changed Over the COVID-19 Crisis, Expanding Addressable TV Opportunities at the Hyperlocal Level
USIM has analyzed six months of Inscape Automated Content Recognition (ACR) main screen TV viewing data. As more devices, Apps, and connections are made to the main screen TV, we have found ACR data to be ideal to measure consumers changing viewing habits with enough detail to deep dive at the hyperlocal level.
Key questions we looked to answer:
How has main screen TV viewing changed over the COVID-19 period and are those changes persisting?
How different are the changes to main screen TV viewing across the US top cities?
What is the implication for Connected TV (CTV) advertising in the US?
Executive Summary – what you need to know:
Total main screen TV viewing minutes increased 26% at the height of the COVID-19 lockdown over pre-COVID-19.
As the lockdown has eased, these numbers have drifted down 5% but still remain at a much higher level than pre-lockdown.
Main screen viewing through traditional cable boxes and satellite have taken the biggest hit in viewing share, falling from 55.5% pre-COVID-19 to 49.0% in June.
Post-crisis peak total minutes viewed via cable box/satellite have risen by 5%, but that is dwarfed by the rise in viewing via streaming devices and Apps.
Streaming devices and Apps have gained a significant share of viewing and total viewing minutes compared to pre-COVID-19.
Streaming devices plugged into the TV (e.g., Amazon Firestick, Roku) have marginally lost total minutes since the peak of the crisis, while streaming Apps on Smart TVs (e.g., YouTube, Tubi) have retained their increased share and total minutes.
Main screen viewing minutes of game consoles have grown steadily since pre-COVID-19 and continue to grow.
Streaming App viewing outgrew streaming device viewing in all major US cities except NY, but growth rates and total viewing were very different in each city.
Streaming App devices still get significantly more total viewing minutes than streaming Apps.
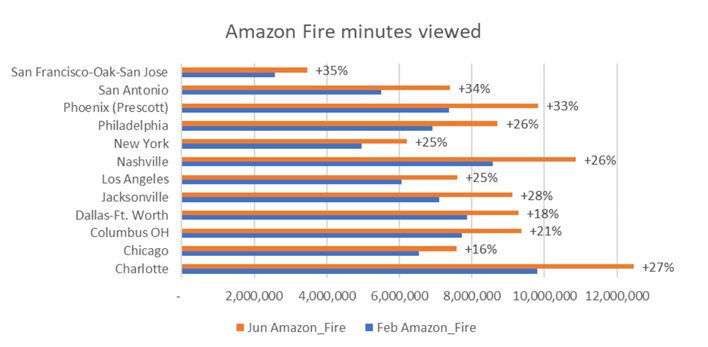
In OTT devices, Amazon Firestick leads the field in total minutes with Apple TV showing the strongest growth compared to pre-COVID-19.
Roku has retained their increased viewing minutes post-peak crisis whereas Amazon, Apple TV, and Chromecast devices have all lost viewing minutes. Total viewing and growth rates to OTT devices vary tremendously by major US city.
Streaming Smart TV Apps that offer free content have shown significant growth, outstripping OTT device growth.
Consumers have discovered the free content available on their Smart TVs and continue to watch those free ad-supported channels post-COVID-19. Again, growth rates and total minutes viewed vary tremendously between major US cities.
Study Background
Inscape provides Automated Content Recognition (ACR) data from approximately 14.5MM Vizio TV sets and measures all the content that is shown on the main screen, whether it comes from a cable or satellite box, Roku or Amazon Firestick, a built-in Smart TV App, or other sources such as gaming consoles. The raw data is massive, with each day of data providing gigabytes of information.
USIM has analyzed the data across three time periods to identify main screen viewing trends:
- Pre-COVID-19 crisis – February 2020
- Peak-COVID-19 crisis – April 2020
- Post-peak COVID-19 crisis– June 2020
USIM examined the ACR data for the top cities in the US from February to Jun 2020 to understand what has changed:
- Charlotte, Chicago, Columbus, Dallas-Ft Worth, Jacksonville, Los Angeles, Nashville, New York, Philadelphia, Phoenix, San Antonio, San Francisco
- All sample sizes were extremely robust at the city level to give high confidence
We measured the changes in total viewing minutes from the exact start time of each TV set viewing session to its exact end time.
Note: Inscape ACR data does not report any viewing to Netflix, Amazon Prime Video, or HULU
Total main screen TV viewing minutes
Main screen TV is classified into four main buckets:
- HDTV/SDTV: viewing via a traditional cable or satellite box or direct via an antenna
- OTT: viewing via a streaming device: Roku, Amazon Fire, Apple TV, Chromecast
- App services: viewing of a Smart TV or device Apps such as Youtube & Youtube TV, Tubi, Pluto TV, WatchFree (Vizio channel), and many others
- Other: viewing of gaming devices plus devices that use the TV as a monitor
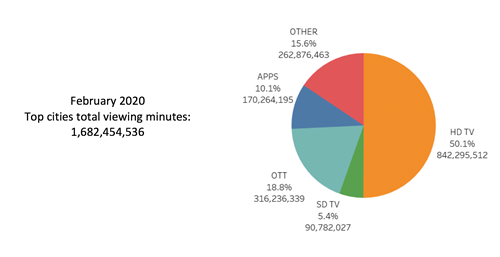
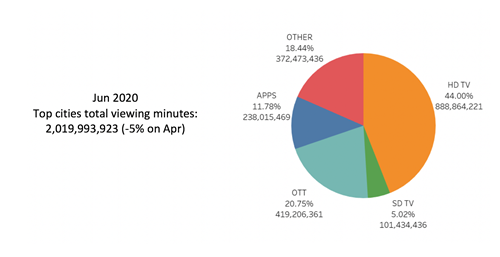
Broadcast viewing (HDTV/SDTV) took the biggest share hit across the entire period – June total viewed minutes are only up 6% on February compared to total viewed minutes, which are up 20% for the same period. Without a significant return of Sports broadcasts, it will be difficult for traditional distribution outlets of TV viewing to regain their previous share (which was eroding prior to the COVID-19 crisis).
OTT device viewing has gained viewing share and minutes from February and interestingly, its share and total viewing minutes have started to slip back a little post-peak crisis.
Viewing to Apps on Smart TV and devices however have shown continued growth throughout the period – even showing good growth post-peak crisis. As we will go on to show, consumers are increasingly seeking out free ad-supported content via these Apps, even as the number of pay streaming service options increases.
Another category, mainly usage of the main screen TV for game consoles, gained significant share and minutes viewed, which indicates a significant increase in game console usage over the period. This is anecdotally supported by recent very strong financial results from gaming companies.
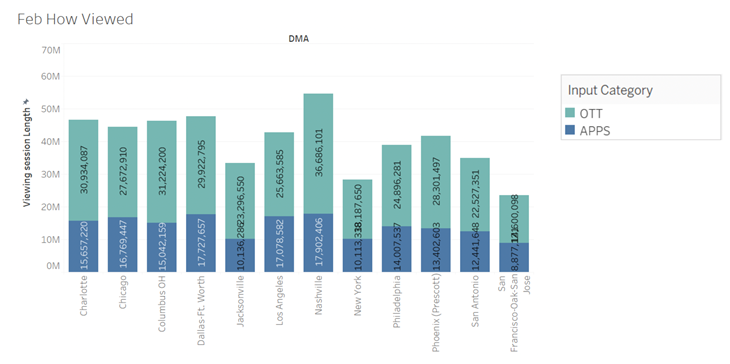
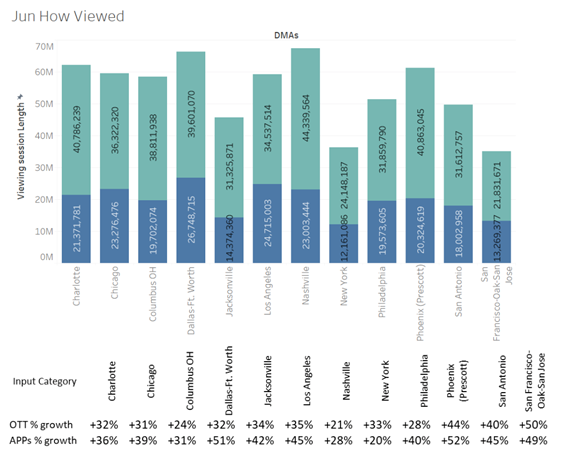
Growth in OTT and App viewing minutes by market is important for addressable advertising growth
(Note: Inscape data does not record minutes viewing to Netflix, Amazon Prime Video, or HULU either on streaming devices or Apps)
Both OTT and App viewing offer critical opportunities for delivery of addressable advertising to targeted segments, audiences, and households. But usage and growth are by no means uniform across the country, with different cities showing significantly different growth rates.
OTT total measured viewing minutes have a significant lead on App total viewing minutes, but viewing to Apps shows a stronger overall growth rate for June 2020 over pre-COVID-19 February 2020. However, this growth rate and the total minutes differential are very different by city, with New York showing a lower App viewing growth rate than for OTT viewing.
While the opportunity to reach addressable households has expanded significantly since February 2020, it is critical to know the exact geography of the target segments and audiences we need to reach in order to pick the most effective and efficient addressable platform.
OTT viewing by device
Diving deeper into the OTT viewing, we see total viewing and growth rates are different by device.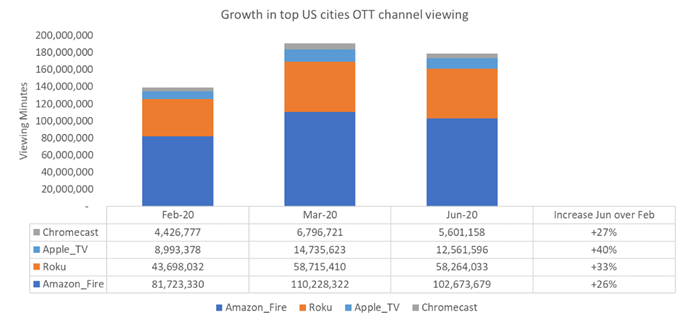
Amazon Firestick retains a strong lead over other streaming devices, but total viewing has diminished a little since the peak-COVID-19 period.
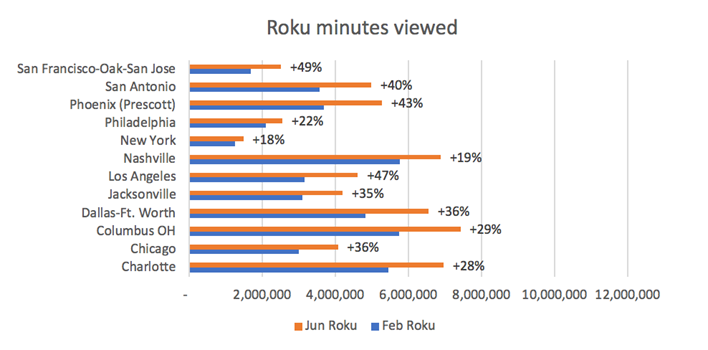
ROKU has maintained its viewing minutes even as Amazon, Apple, and Chromecast have receded from their peak.
As mentioned before, these trends can vary significantly by city and make it vital to understand the geography of the target audience segments in order to make OTT advertising as effective as possible.
OTT viewing by show
ACR data allows us to look at content viewing at the show level and USIM has deep-dived into content consumption by platform by major US cities.
For OTT, while sports were on-air, viewing rankers were primarily dominated by sports content in all cities.
However, as sports broadcasts were restricted by the COVID-19 crisis, content viewing has become much more diverse in major US cities.
App Viewing
Viewing to streaming Apps via Smart TVs or devices have shown accelerated growth during the COVID-19 crisis and have continued that growth (at a somewhat reduced rate) post-peak crisis. The list of available Apps measured by ACR data is long – here we have shown the growth for the top 7 Apps.
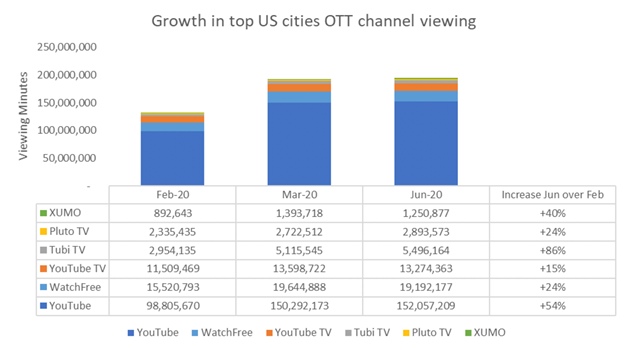
Note: WatchFree is a dedicated Vizio free content App that is available on all Vizio Smart TVs
Amongst the top seven Apps, the lowest growth rate is for YouTube TV – the only paid subscription App.
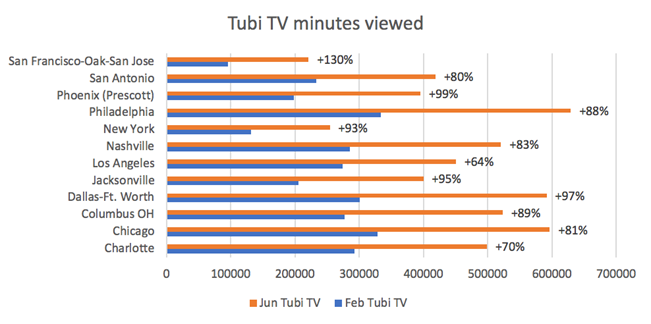
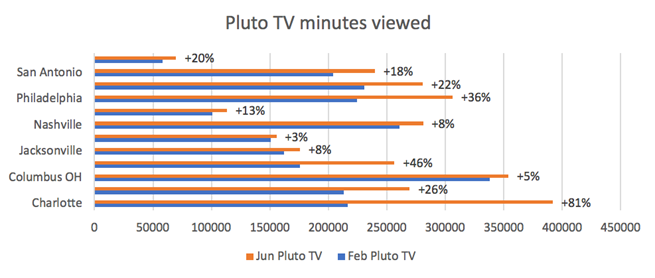
The greatest growth has come from the ad-supported free content Apps such as YouTube, Pluto TV, and Tubi.
As we saw with OTT viewing, the total level of viewing minutes is unevenly distributed by major US cities and reflects the need for geographic targeting. Here we show a breakdown of two of the more popular ad-supported free content Apps – Tubi and Pluto TV
App viewing by show
App viewing is not dominated by sports and consequently, has shown substantial changes pre- vs post-COVID-19 peak. Movies, dramas, and reality dominate the top shows in major US cities, and Arnie appears to be king of the Streaming Apps.
The consistency of content viewing on these Apps might be seen as another advantage to allow for better control of the frequency of exposure and pacing of advertising to target households and segments.
Conclusion: Viewing patterns continue to change rapidly and understanding localized patterns is critical.
Traditional TV viewing via a cable box, satellite, or direct antenna has lost a significant share of total main screen viewing and its total minutes viewed have not kept pace with other viewing platforms. Sports broadcasts may help, but now that households have discovered free ad-supported content via Apps, it will be difficult to regain lost share.
The increase in ad-supported addressable CTV viewing across both OTT and Apps is making household addressable advertising an ever more viable video choice for brand advertisers.
Large variances have been seen in addressable viewing behaviors by location both for streaming devices and Apps. It is critical to understand the geography of a target audience in order to most effectively take advantage of these addressable platforms.