NEXUS® Machine Learning Algorithm Enables Daily Marketing Mix Modeling (MMM) and Channel Optimization to Increase In-Store Sales: Case Study

NEXUS® is USIM’s proprietary reporting and analytics platform, ingesting real-time client sales data, customer actions via the website, CRM platforms, and detailed media performance data. The platform enriches the data with high-level analytics and forecasting to create real-time, sales-based optimizations and deliver improved results.
NEXUS® tracks daily sales, year-on-year same-store sales, and granular sales details like channel purchased and the entrée mix at the national and local market levels. NEXUS® MMM ingests average checks, weather/seasonality impacts, new store openings, and other market forces to uncover insights into customer purchasing behavior at the national and local levels to highlight each market’s driving forces and marketing return on investment (ROAS).
The following case study illustrates the power of NEXUS® and what it can do for you.
CLIENT BACKGROUND
After continuing their success in 2022 in the first quarter of 2023, Brand X’s same-store sales performance deteriorated. Last click media sales attribution was insufficient to explain sales changes as only 20-25% of Brand X’s sales orders were made online, with the rest in-store.
NEXUS® STRATEGIC INSIGHTS
To understand the forces behind the decline and reverse them, we employed NEXUS®’s MMM real-time capabilities, specifically creating custom optimizations for different market tiers according to how they responded to pricing and media changes. Brand X’s key performance metrics were more sophisticated than weekly gross system sales and total revenue; they judged success by weekly same-store sales performance (excluding new/closed and unique stores like airport locations) compared to the equivalent previous year's week
NEXUS® Tracks Weekly Gross Total System Sales:
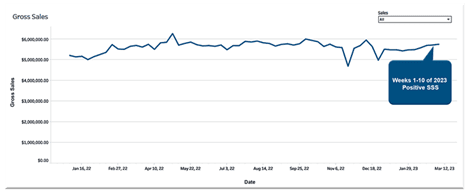
Through NEXUS® we were able to break down the weekly same-store sales performance for national and by market and found consistent, strong growth in weeks 1 – 10 of 2023 (Jan-Feb).
NEXUS® Tracks Same Store Sales (SSS) Growth vs. Previous Year or Previous Week:
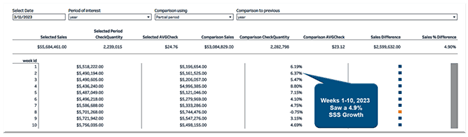
However, we found that in weeks 11-18, 2023 (March-April), there was a reduction of 2.9 % in same store-sales growth (from 4.9% to 2.0%) – a level below competitive brand growth in the brand’s footprint.
NEXUS® Identified a Drop in SSS Immediately

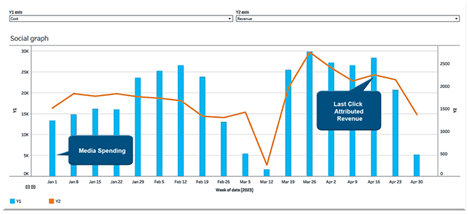
Digging deeper with NEXUS®’s media performance reporting, we found that last click attributable revenue to media spending had marginally risen across weeks 11-18, 2023.
NEXUS® Weekly Social Media Spending (blue bars) and Last Click Attributed Revenue for Social Media:
Last-click media sales attribution was insufficient to explain the total market sales changes. To address this, we developed a proprietary XG BOOST Machine Learning algorithm for MMM that produced fast, accurate media mix models. The algorithm directly ingested the client’s sales data at the granular store level, daily media spend, and performance data, integrating them with market-level economic and consumer data, seasonality, and weather.
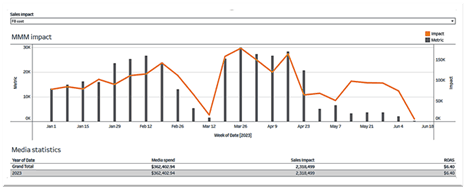
NEXUS® MMM – MEDIA INSIGHTS
The new MMM model utilizes full attribution versus the last-click sales attribution available from digital media to identify our media's positive impact on total sales for the brand based.
The following visualizes and highlights NEXUS’s MMM analysis of Brand X’s 2023 full ROAS for Social, which drove a ROAS of $6.40 instead of Social’s last click ROAS of $0.75.
NEXUS® MMM Analysis of 2023 Full ROAS for Social:
| Media Platform | 2023 Last Click ROAS | 2023 NEXUS® MMM ROAS |
| Social media | $0.75 | $6.40 |
| Display media | $0.92 | $8.45 |
| CTV media | Not Available | $5.33 |
| Search media | $4.54 | $3.44 |
NEXUS® MMM – PRICE ELASTICITY
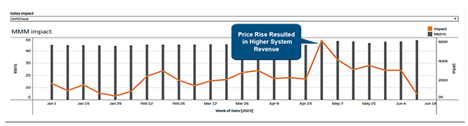
Brand X, against market dynamics, had raised prices in 2023. We demonstrated that at the system's national level, as prices had increased, so had the total revenue, indicating the higher prices did not dissuade customers.
Average Check Increases Drove Higher Brand Revenue (Offset Reduction in Traffic from Higher Pricing)
NEXUS® MMM – WEATHER AND SEASONALITY
NEXUS® ingests and factors in variables such as daily weather reports, brand seasonality, and holidays to measure their impact on brand revenue.
Overall Negative Impact of Increased Precipitation on Brand X:
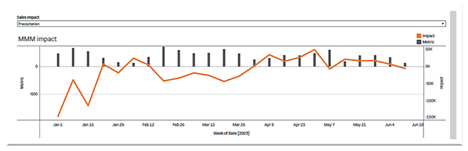
The above highlights the degree that rain and snowfall should be accounted for in Brand X’s sales forecasting. Brand X’s financial planners then unitized the results to improve sales forecasting and performance modeling.
NEXUS® MMM – MARKET LEVEL ANALYSIS
NEXUS®’s MMM operates at the media market level (DMA level) to highlight the differences in consumer behavior and response rates at the granular market level.
We found that in more established and higher penetration markets with more price elasticity and traffic were not impacted when the brand was obliged to increase prices. In fact, Brand X had a stronger ROAS for the lower funnel, call-to-action media such as Display and Search.
In newer markets with lower penetration rates, we saw overall revenue reductions from price increases as traffic was impacted and customers switched to other options. IN THESE MARKETS, Brand X had better ROAS from the upper funnel (awareness) media, such as Social and CTV.
OVERALL RESULTS
NEXUS®’s MMM capabilities analyzed the media contribution to revenue and proved to the brand’s management and financial officers the strong, positive impact of media on the contribution to overall sales.
The findings highlighted opportunities to reoptimize media budgeting, geographic spending prioritization, and channel mix. And it demonstrated that in markets that responded more strongly to media spending, an increase in investment would deliver greater brand revenue – a return of 5+% year-over-year – and drive same-store sales growth.
Brand X once again overtook competitive growth and continues to maintain its leadership position.
How Can USIM Reach your Goals?
USIM’s digital team has found success executing campaigns for multiple brands. Our team takes into consideration all best practices while applying a nuanced approach for each advertiser based on their budget, flighting, objectives, and assets.
When working with USIM to plan and activate, our team provides high-level direction on creative in addition to recommendations for each campaign.
For more information on how USIM can help optimize your marketing strategy, connect with your individual planning team to discuss next steps.
